From perfect to sample information
EVPI assumes the manager can learn the true state with certainty. In practice, data collection only partially resolves uncertainty. EVSI quantifies how much it is worth to collect a specific sample — one whose possible outcomes and resulting belief updates are known in advance.
The chytrid test
We continue with the Canessa et al. (2015) problem from vignettes 1–2. The chytrid test has two outcomes:
- Positive ( = 0.395): posterior = 0.92.
- Negative ( = 0.605): posterior = 0.22.
Posteriors are derived via Bayes’ theorem from the test sensitivity and specificity:
data("canessa2015")
V       <- canessa2015$V
p_prior <- canessa2015$p

# Marginal probability of each test outcome: p(x_k)
p_outcome <- c(positive = 0.395, negative = 0.605)

# Posterior beliefs after each test outcome (rows = outcomes, cols = states)
# Derived from test sensitivity/specificity via Bayes' theorem
test_matrix <- matrix(c(0.73, 0.27,   # P(positive | state)
                         0.06, 0.94),  # P(negative | state)
                      nrow = 2, byrow = TRUE)
p_posterior <- test_matrix * p_prior / p_outcome  # Bayes update: p(s|x_k) = p(x_k|s) p(s) / p(x_k)

p_posterior
#>            [,1]      [,2]
#> [1,] 0.92405063 0.3417722
#> [2,] 0.04958678 0.7768595
chytrid_si <- voi_problem(V, p_prior, p_posterior, p_outcome)Risk-neutral EVSI
The calculate_evsi() wrapper handles the full
calculation and shows which action is best under each test outcome:
result_rn <- calculate_evsi(V, p_prior, p_posterior, p_outcome,
                             outcome_name = "frogs")
#>       action chytrid_present chytrid_absent EV_prior best_action?
#>  translocate              55            135       95
#>    no_action             100            100      100          YES
The full pipe produces the same answer:
result_rn2 <- chytrid_si |>
  transform_to_utility() |>
  optimize_action() |>
  calculate_utility_dist() |>
  summarize_utility() |>
  transform_to_values() |>
  calculate_value_info()

result_rn2$value_info
#> [1] 15.1
The risk-neutral EVSI ≈ 10.4 frogs, matching Canessa et al. (2015). The imperfect chytrid test is worth 10.4 frogs — compared to 17.5 for perfect information. The test captures about 60 % of the value of perfect information.
Risk-averse EVSI
rp  <- risk_preference("CRRA", param = 1, val_min = 0, val_max = 200,
                        outcome_name = "frogs", maximize = TRUE)
fns <- use_risk_preference(rp)

result_ra <- chytrid_si |>
  transform_to_utility(fns$utility) |>
  optimize_action() |>
  calculate_utility_dist() |>
  summarize_utility() |>
  transform_to_values(fns$inv_utility) |>
  calculate_value_info()

cat("Risk-neutral EVSI:", round(result_rn$value_info, 2), "frogs\n")
#> Risk-neutral EVSI: 15.1 frogs
cat("Risk-averse EVSI: ", round(result_ra$value_info, 2), "frogs (gamma = 1)\n")
#> Risk-averse EVSI:  13.1 frogs (gamma = 1)
What changes between test outcomes
Under risk aversion, the manager also cares about which test outcome they receive. We can inspect the utility distributions directly:
pipe_ra <- chytrid_si |>
  transform_to_utility(fns$utility) |>
  optimize_action() |>
  calculate_utility_dist()

# Actions chosen after each test result
cat("Action if positive test:", rownames(V)[pipe_ra$a_certainty[1]], "\n")
#> Action if positive test: no_action
cat("Action if negative test:", rownames(V)[pipe_ra$a_certainty[2]], "\n")
#> Action if negative test: translocate
cat("Action without test:    ", rownames(V)[pipe_ra$a_uncertainty[1]], "\n")
#> Action without test:     no_action
A positive test leads to no translocation (chytrid likely present); a negative test leads to translocation (chytrid likely absent). Without the test, no translocation is already the optimal choice — so the test only changes the decision when it returns negative.
EVSI vs. EVPI: the information gap
The chytrid test captures about 60 % of the ceiling EVPI under risk neutrality. Under risk aversion the picture shifts: EVPI falls (the safe “no action” floor becomes more attractive) and EVSI falls with it, but the fraction captured by the test stays roughly the same.
# EVPI under each risk preference
evpi_rn <- voi_problem(V, p_prior) |>
  transform_to_utility() |>
  optimize_action() |>
  calculate_utility_dist() |>
  summarize_utility() |>
  transform_to_values() |>
  calculate_value_info()

evpi_ra <- voi_problem(V, p_prior) |>
  transform_to_utility(fns$utility) |>  # fns defined in evsi-ra chunk above
  optimize_action() |>
  calculate_utility_dist() |>
  summarize_utility() |>
  transform_to_values(fns$inv_utility) |>
  calculate_value_info()

# Grouped barplot: rows = EVPI / EVSI, cols = risk preference
bar_mat <- matrix(
  c(evpi_rn$value_info, result_rn$value_info,
    evpi_ra$value_info, result_ra$value_info),
  nrow = 2,
  dimnames = list(
    c("EVPI (ceiling)", "EVSI (chytrid test)"),
    c("Risk-neutral", "Risk-averse (γ = 1)")
  )
)

mp <- barplot(bar_mat, beside = TRUE,
              col = c("#2c7fb8", "#7fcdbb"),
              ylab = "Frogs (certainty equivalent)",
              main = "Information value: EVPI ceiling vs EVSI",
              ylim = c(0, max(bar_mat) * 1.3),
              legend.text = TRUE,
              args.legend = list(x = "topright", bty = "n"))

# Annotate the fraction captured
for (j in seq_len(ncol(bar_mat))) {
  frac <- round(bar_mat[2, j] / bar_mat[1, j] * 100)
  text(x = mean(mp[, j]), y = bar_mat[1, j] + 0.5,
       labels = sprintf("%d%%", frac), cex = 0.8, col = "grey30")
}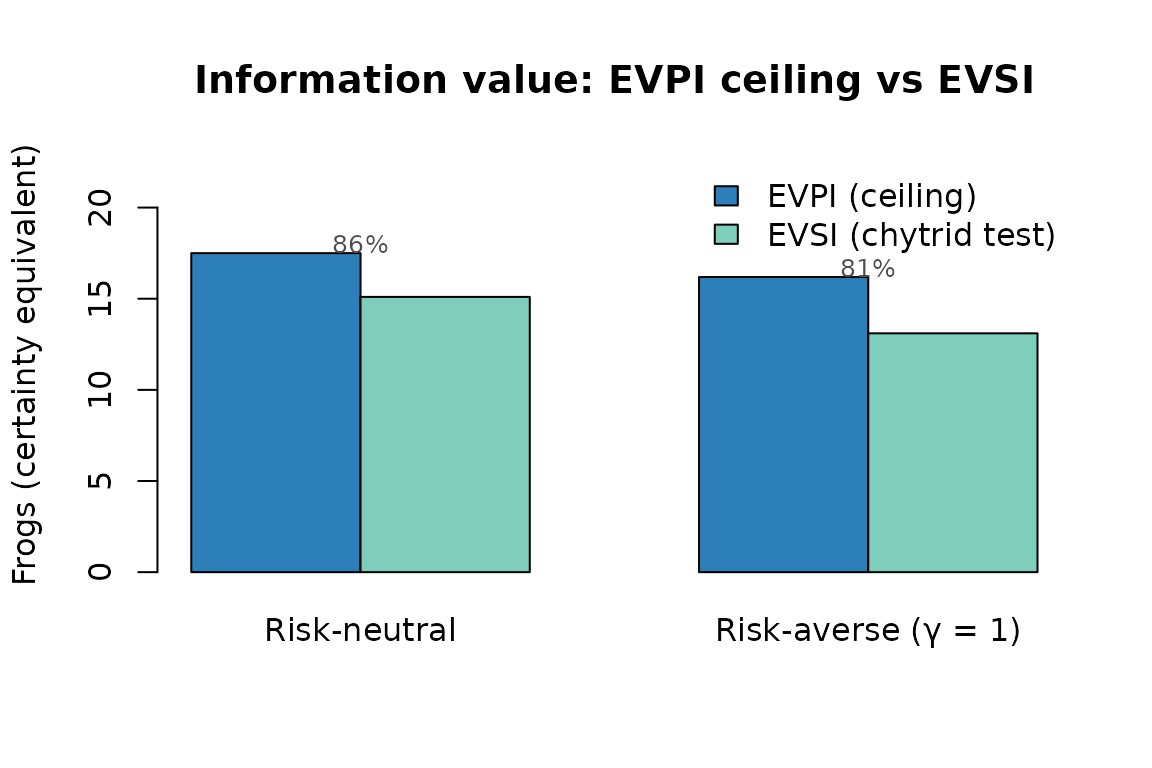
EVSI as a fraction of the EVPI ceiling, under risk-neutral and risk-averse preferences. Both shrink as risk aversion increases, but the test retains ~60% of the ceiling in both cases.
print(round(bar_mat, 2))
#>                     Risk-neutral Risk-averse (γ = 1)
#> EVPI (ceiling)              17.5               16.19
#> EVSI (chytrid test)         15.1               13.10
cat("\nFraction of ceiling captured by the chytrid test:\n")
#>
#> Fraction of ceiling captured by the chytrid test:
cat("  Risk-neutral:         ",
    round(bar_mat[2, 1] / bar_mat[1, 1] * 100, 1), "%\n")
#>   Risk-neutral:          86.3 %
cat("  Risk-averse (γ = 1):  ",
    round(bar_mat[2, 2] / bar_mat[1, 2] * 100, 1), "%\n")
#>   Risk-averse (γ = 1):   80.9 %